Rectangular waveguide S-parameters
Build a PEC rectangular waveguide, terminate it with two wave ports, sweep them, and check the S-matrix against the analytic TE10 mode.
This tutorial measures the S-parameters of a straight, air-filled rectangular waveguide between two WavePorts. A straight guide has a known answer: no reflection, full transmission, and a transmission phase set by the TE10 propagation constant. That makes it the right first check before you model a real waveguide device. The scene is adapted from benchmark/scenes/rf/rectangular_waveguide.py in the Maxwell repository.
You need a CUDA GPU. The script runs in about 40 seconds on a recent GPU.
The setup#
- The guide is 0.6 m wide (y) and 0.3 m high (z), so the TE10 cutoff is
fc = c / (2a), about 250 MHz. - Four PEC boxes form the walls. They run through the PML at both ends, so the guide looks infinitely long and the open wall ends do not reflect.
- Two wave ports sit 0.6 m apart at x = -0.3 m and x = +0.3 m. Each port's reference plane is at its own position.
- A port sweep drives each port in turn at six frequencies from 1.2 fc to 2.2 fc, where only TE10 propagates.
Full script#
import numpy as np
import matplotlib.pyplot as plt
import witwin.maxwell as mw
from witwin.maxwell.constants import C_0

a, b = 0.60, 0.30          # inner width (y) and height (z) of the guide, m
dl = 0.025                 # cell size, m
pml = 8                    # PML layers on each face
fc = C_0 / (2 * a)         # TE10 cutoff frequency, Hz (about 250 MHz)

scene = mw.Scene(
    domain=mw.Domain(bounds=((-0.6, 0.6), (-0.5, 0.5), (-0.35, 0.35))),
    grid=mw.GridSpec.uniform(dl),
    boundary=mw.BoundarySpec.pml(num_layers=pml),
    device="cuda",
)

# Four PEC walls. They run through the PML on both ends so the guide looks infinitely long.
wall_length = 2 * (0.6 + pml * dl) + 8 * dl
for name, position, size in (
    ("wall_y_high", (0.0, 0.40, 0.0), (wall_length, 0.20, 0.70)),
    ("wall_y_low", (0.0, -0.40, 0.0), (wall_length, 0.20, 0.70)),
    ("wall_z_high", (0.0, 0.0, 0.25), (wall_length, 0.60, 0.20)),
    ("wall_z_low", (0.0, 0.0, -0.25), (wall_length, 0.60, 0.20)),
):
    scene.add_structure(
        mw.Structure(name=name, geometry=mw.Box(position=position, size=size), material=mw.Material.pec())
    )

# One wave port at each end, 0.6 m apart, both looking into the guide.
for name, x, direction in (("left", -0.3, "+"), ("right", 0.3, "-")):
    scene.add_port(
        mw.WavePort(
            name,
            position=(x, 0.0, 0.0),
            size=(0.0, a, b),
            direction=direction,
            reference_plane=x,
            modes=(mw.WaveModeSpec("te", polarization="Ez"),),
        )
    )

freqs = tuple(float(f) for f in np.linspace(1.2 * fc, 2.2 * fc, 6))
result = mw.Simulation.fdtd(
    scene,
    frequencies=freqs,
    excitations=mw.PortSweep(),
    run_time=mw.TimeConfig.auto(steady_cycles=8, transient_cycles=16),
).run()

net = result.network
S = net.s.detach().cpu().numpy()          # shape (6, 2, 2)
print("channels:", net.port_names)

length = 0.6
beta = np.sqrt((2 * np.pi * np.array(freqs) / C_0) ** 2 - (np.pi / a) ** 2)
expected_phase = np.angle(np.exp(1j * beta * length))
for i, f in enumerate(freqs):
    print(
        f"{f / 1e6:6.1f} MHz  |S11| = {abs(S[i, 0, 0]):.3f}  |S21| = {abs(S[i, 1, 0]):.3f}  "
        f"arg S21 = {np.angle(S[i, 1, 0]):+.3f}  beta*L = {expected_phase[i]:+.3f}"
    )

net.save("waveguide_network.pt")

f_mhz = np.array(freqs) / 1e6
fig, ax = plt.subplots(figsize=(6, 3.5))
ax.plot(f_mhz, 20 * np.log10(np.abs(S[:, 1, 0])), "o-", label="|S21|")
ax.plot(f_mhz, 20 * np.log10(np.abs(S[:, 0, 0])), "s-", label="|S11|")
ax.set_xlabel("Frequency (MHz)")
ax.set_ylabel("dB")
ax.legend()
ax.grid(True, alpha=0.3)
fig.savefig("waveguide_s_params.png", dpi=110, bbox_inches="tight")
Expected output#
channels: ('left::TE0', 'right::TE0')
299.8 MHz |S11| = 0.014 |S21| = 0.987 arg S21 = +2.082 beta*L = +2.084
349.8 MHz |S11| = 0.001 |S21| = 1.000 arg S21 = +3.081 beta*L = +3.078
399.7 MHz |S11| = 0.003 |S21| = 1.000 arg S21 = -2.356 beta*L = -2.359
449.7 MHz |S11| = 0.005 |S21| = 1.000 arg S21 = -1.577 beta*L = -1.581
499.7 MHz |S11| = 0.005 |S21| = 1.000 arg S21 = -0.834 beta*L = -0.842
549.6 MHz |S11| = 0.001 |S21| = 1.000 arg S21 = -0.116 beta*L = -0.127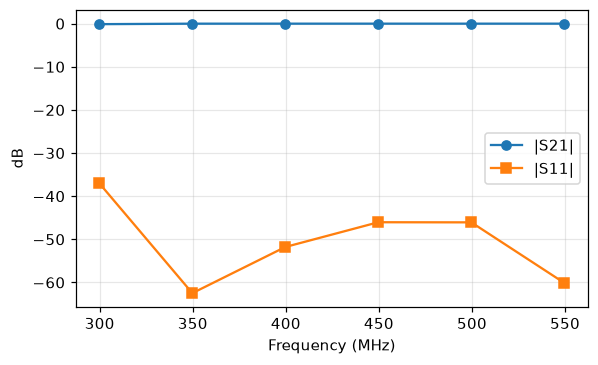 |S21| close to 0 dB and |S11| below -35 dB from 300 to 550 MHz
Reading the result#
- Transmission.
|S21|is 1.000 to three digits above 1.4 fc. Close to cutoff (300 MHz), the mode is slow and the grid resolves it less well, so|S21|drops to 0.987. - Reflection.
|S11|stays below 0.015 (below -35 dB), which is the numerical reflection of the ports and the PML. - Phase.
arg S21matchesbeta * Lto within 0.011 rad, wherebeta = sqrt(k0² - (pi / a)²)is the TE10 propagation constant. The sign is positive because Maxwell uses theexp(-i omega t)phasor convention; tools that useexp(+j omega t)report the conjugate. - Channels. Each port mode is a network channel named
"<port>::<mode>", hereleft::TE0andright::TE0.
Exporting the network#
net.save(path) writes a snapshot that mw.NetworkData.load(path) reads back. To write a Touchstone file, first renormalize: a WavePort's reference impedance is the TE10 wave impedance, which changes with frequency, and a Touchstone file holds one value per port. net.to_touchstone(...) raises ValueError otherwise.
net.renormalize(50.0).to_touchstone("waveguide.s2p")The renormalized S-matrix describes the guide as seen from 50 Ω ports, so it shows large reflections. That is correct for that reference, not a simulation error.
Next steps#
- Put a device between the ports (an iris, a post or a dielectric block) and compare its S-parameters with the straight guide.
- Read Mode ports and S-parameters for port placement rules and the
NetworkDatamethods.